Child obesity statistics and teenage obesity statistics have been tracked since 1963 (1) (2). Between then and now, the rate of obese children and teens has gone from about 4.5% (1 in 22) to almost 17% (1 in 6).
This page breaks down the childhood obesity statistics (6 to 11 years old) and teen obesity statistics (12 to 19 years old). Note that obesity in children and teens is classified as having an age- and gender-specific body mass index at or above the 95th percentile.
TABLE OF CONTENTS
Click on any of the topics below to jump directly to that section
- By Geography
- By Age & Gender
- By Age and Race/Ethnicity
- Impact of Childhood Obesity
- Find a Weight Loss Surgeon
SECTION SUMMARY:
- The Midwest and South have the highest rates of obesity
The prevalence of overweight/obese children (10-17 years old) varies by region. States in the South have the highest rates, Western states have the lowest. The Midwest and Northeast are similar, both averaging around a 30% overweight/obesity rate.
The West – 26% Obesity Rate
- California – 31.2%
- Nevada – 30.5%
- Colorado – 27.2%
- Wyoming – 27.1%
- Arizona – 26.9%
- Alaska – 26.3%
- Idaho – 26%
- Hawaii – 25.5%
- Washington – 25.5%
- New Mexico – 24.9%
- Montana – 23.2%
- Oregon – 20.3%
- Utah 19.2%
The Midwest – 31% Obesity Rate
- North Dakota – 37.1%
- Indiana – 33.9%
- Ohio – 33.1%
- Michigan – 32.0%
- South Dakota – 31.4%
- Kansas – 30.9%
- Iowa – 29.9%
- Wisconsin – 29.5%
- Missouri – 29.4%
- Nebraska – 29.2%
- Minnesota – 27.7%
- Illinois – 27%
The South – 34% Obesity Rate
- Tennessee – 37.7%
- Mississippi – 37%
- Florida – 36.6%
- West Virginia – 35.1%
- Alabama – 35.5%
- Louisiana – 34.0%
- Arkansas – 33.9%
- Kentucky – 33.5%
- Texas – 33.3%
- South Carolina – 32.9%
- Georgia – 32.2%
- North Carolina – 30.9%
- Virginia 27.2%
The Northeast – 29% Obesity Rate
- Rhode Island – 36.3%
- DC – 31.8%
- Maryland – 33.6%
- New York – 31.8%
- Pennsylvania – 31.7%
- New Jersey – 31.7%
- Delaware – 30.9%
- Connecticut – 30.2%
- Maine – 28.2%
- Massachusetts – 26.6%
- New Hampshire – 23.8%
- Vermont – 22.2%
(References:A)
SECTION SUMMARY:
- Sharp increases in obesity began in the 1970’s
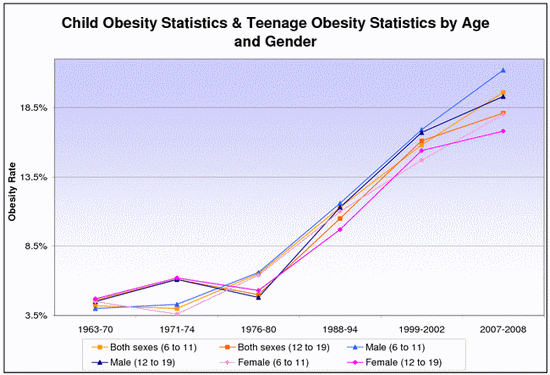
Both males and females have seen significant increases in obesity rates over the last 45 years, although the rate of obese female children and teenagers is now slightly lower than that of obese males.
For children aged 6 to 11, the obesity rates for boys and girls were virtually identical until around 1999 when the rate of obese boys began to increase at a faster rate. As of the latest data, 21.2% of boys were obese compared to 18% of girls.
Teenagers aged 12 to 19 have shown a similar trend, with obesity in male teenagers most recently reaching 19.3% versus obese female teenagers who were most recently recorded at 16.8%.
The following chart and spreadsheet compare three groups for the childhood and teenage age ranges:
- Both genders
- Male only
- Female only

Obesity Percentages By Age and Gender
Tap here to see a chart of obesity percentages by age and gender.
| 1963 -70 | 1971 -74 | 1976 -80 | 1988 -94 | 1999 -2002 | 2007 -08 | |
|---|---|---|---|---|---|---|
| Both (6-11) | 4.2% | 4.0% | 6.5% | 11.3% | 15.8% | 19.6% |
| Both (12-19) | 4.6% | 6.1% | 5.0% | 10.5% | 16.1% | 18.1% |
| Male (6-11) | 4.0% | 4.3% | 6.6% | 11.6% | 16.9% | 21.2% |
| Male (12-19) | 4.5% | 6.1% | 4.8% | 11.3% | 16.7% | 19.3% |
| Female (6-11) | 4.5% | 3.6% | 6.4% | 11.0% | 14.7% | 18.0% |
| Female (12-19) | 4.7% | 6.2% | 5.3% | 9.7% | 15.4% | 16.8% |
SECTION SUMMARY:
- Sharp increases in the late 1970’s
- Some groups decline in obesity in the late 1990’s
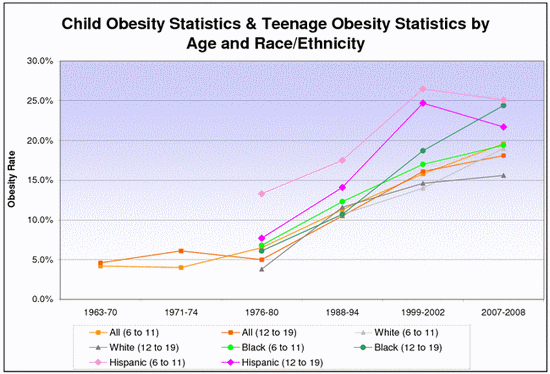
Childhood and teen obesity statistics broken out by race/ethnicity have been available since 1976 for 3 ethnicities:
- Blacks/African Americans
- Hispanics/Latinos
- Whites
Of the three ethnicities evaluated, Hispanics/Latinos have the highest childhood obesity rates (6 to 11 years old) while African Americans have the highest teenage obesity rates (12 to 19 years old).
Whites had the lowest obesity rates in both age groups, although the obesity rates for whites were still alarmingly high at 19% of children and 15.6% of teens.
The following spreadsheet and chart compares the 3 tracked ethnicities for both the childhood and teen age groups:

Obesity Percentages By Age and Ethnicity
Tap here to expand a chart of obesity percentages by age and ethnicity.
| 1963 -70 | 1971 -74 | 1976 -80 | 1988 -94 | 1999 -2002 | 2007 -08 | |
|---|---|---|---|---|---|---|
| All (6-11) | 4.2% | 4.0% | 6.5% | 11.3% | 15.8% | 19.6% |
| All (12-19) | 4.6% | 6.1% | 5.0% | 10.5% | 16.1% | 18.1% |
| White (6-11) | n/a | n/a | 6.1% | 10.7% | 14.0% | 19.0% |
| White (12-19) | n/a | n/a | 3.8% | 11.6% | 14.6% | 15.6% |
| Black (6-11) | n/a | n/a | 6.8% | 12.3% | 17.0% | 19.4% |
| Black (12-19) | n/a | n/a | 6.1% | 10.7% | 18.7% | 24.4% |
| Latino (12-19) | n/a | n/a | 13.3% | 17.5% | 26.5% | 25.1% |
| Latino (12-19) | n/a | n/a | 7.7% | 14.1% | 24.7% | 21.7% |
SECTION SUMMARY:
- Increased likelihood of adult obesity
Does being an obese child or teenager make one more likely to become an obese adult?Yes… the more overweight and the older the obese child is, the more likely he or she is to become an obese adult (3).
Just how likely varies by study…
- Study 1 found that about one-third of children who are obese in preschool and about half of school-age children become obese adults.
- Study 2 found that about 2 out of every 3 children in the 95th percentile or above had a body mass index of at least 35 as adults.
- Study 3 found that compared with children with a body mass index below the 50th percentile, kids between the 50th and 74th percentiles about five times more likely to become overweight adults and those with a body mass index between the 75th and 84th percentiles were up to 20 times more likely.
- According to the Surgeon General, overweight adolescents have a 70% chance of becoming overweight or obese adults. The likelihood increases to 80% if one or both parents are overweight or obese.


